
Home
A comprehensive resource for safe and responsible laser use
US: 2011 total: 3,591 laser/aircraft incidents
The number of laser/aircraft incidents in the U.S. during the period January 1 through December 31 2011 was 3,591. This was an average of 9.8 incidents each night.
Note: The FAA reports the 2011 total as 3,592. This is because the last entry in the FAA’s laser incident spreadsheet is on line 3,592. However, the spreadsheet headings are on line 1, so the actual number of 2011 incidents is 3,591 -- the number we use below.
What is an FAA-reported “laser incident”?: This is defined as an aircraft pilot seeing one or more laser beams during flight. A mid-2011 study by Rockwell Laser Industries of 6,903 incidents reported to the U.S. Federal Aviation Administration found that in 27% of incidents, beams entered the cockpit (passed through the windscreen). For example, in 2011, there were 3,591 incidents of which approximately 970 (27%) involved beams in the cockpit.
PowerPoint version available: A set of slides, presented to the SAE G10 aviation safety committee on Jan. 31, 2012, is available on the Files and Downloads page.
This is a total of approximately 10,201 incidents reported to FAA, from 2004 through the end of 2011.
In these 55 incidents…
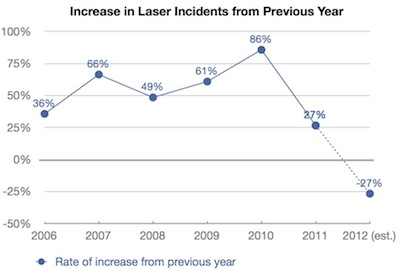
The rate of increase dropped 59% in 2011 (from 86.4% to 27%). If there is another 59% drop in 2012, (dashed line), then there would be a decrease in laser incidents for the first time, from 3,591 incidents in 2011 to 2,836 incidents projected for 2012.
Note: The FAA reports the 2011 total as 3,592. This is because the last entry in the FAA’s laser incident spreadsheet is on line 3,592. However, the spreadsheet headings are on line 1, so the actual number of 2011 incidents is 3,591 -- the number we use below.
What is an FAA-reported “laser incident”?: This is defined as an aircraft pilot seeing one or more laser beams during flight. A mid-2011 study by Rockwell Laser Industries of 6,903 incidents reported to the U.S. Federal Aviation Administration found that in 27% of incidents, beams entered the cockpit (passed through the windscreen). For example, in 2011, there were 3,591 incidents of which approximately 970 (27%) involved beams in the cockpit.
PowerPoint version available: A set of slides, presented to the SAE G10 aviation safety committee on Jan. 31, 2012, is available on the Files and Downloads page.
Yearly Comparison
Here are the number of incidents reported to FAA in recent years:- 2011: 3,591 incidents (9.8 per night)
- 2010: 2,836 incidents (7.7 per night)
- 2009: 1,527 incidents (4.2 per night)
- 2008: 949 incidents (2.6 per night)
- 2007: 639 incidents (1.8 per night)
- 2006: 384 incidents (1.1 per night)
- 2005: 283 incidents (0.78 per night)
- 2004: 46 incidents (0.13 per night) involving an unknown number of aircraft Note: FAA mandated that pilots report incidents using Advisory Circular 70-2, beginning January 19 2005. Before this date, pilot reporting was voluntary.
This is a total of approximately 10,201 incidents reported to FAA, from 2004 through the end of 2011.
Adverse Effects
In 55 of the 3,591 laser/aircraft incidents (1.5%), a pilot or aircraft occupant reported a temporary adverse visual effect such as flashblindness, afterimage, blurry vision, eye irritation and/or headache. None of these effects was classified as a recordable injury by FAA medical experts.In these 55 incidents…
- … there were 31 reports of pain or discomfort in the eyes or elsewhere (e.g., headache).
- … there were 31 reports of vision impairment such as afterimages (10) and blurry vision (7).
- … seven persons sought medical treatment after the laser exposure.
- … one person was grounded temporarily.
- … three flights were affected: in two cases, the pilot turned control over to the co-pilot; in one case the pilot felt he had to land immediately.
Rate of increase, by year
While laser incidents continue to increase, during 2011 the rate of increase slowed significantly.The rate of increase dropped 59% in 2011 (from 86.4% to 27%). If there is another 59% drop in 2012, (dashed line), then there would be a decrease in laser incidents for the first time, from 3,591 incidents in 2011 to 2,836 incidents projected for 2012.
Laser beam colors reported
Of the 3,591 laser/aircraft incidents in 2011, the following beam colors were reported: Green: 3,381 (94.2%)
Red: 66 (1.8%)
White: 48 (1.3%)
Blue: 31 (0.9%)
Unknown color: 26 (0.7%)
-------------------------------
Other (1.1%):
Green and Red: 6
Yellow: 5
Purple: 4
Green/White: 3
Green laser, White spotlight: 3
Green/Blue: 2
Blue/Green: 2
Blue/Purple: 1
Blue and Red: 1
Blue/White: 1
Green/Purple: 1
Green to Red to White: 1
Grey/White: 1
Multi-color: 1
Orange/White: 1
Orange/Yellow: 1
Purple/Blue: 1
Red, Green, Blue: 1
Yellow/White: 1
Incidents by Type (cockpit illumination, intentional exposure, eye effects & injuries)
In mid-2011, Rockwell Laser Industries analyzed 6,903 FAA reports from 2004 to mid-March 2011. They found that the cockpit was illuminated only in about 1,875 incidents (27%). The exposure appeared intentional in about 350 incidents (5% of all illuminations), defined as multiple exposures or the beam tracking the aircraft.There were about 100 incidents (1.5% of all incidents) where eye effects or injuries were reported. (A separate analysis by LaserPointerSafety.com shows that the vast majority of eye effect/injury reports are of minor, temporary effects. There are a few claims of eye injuries, and a very few claims of retinal injury.)
More information and a visual chart about RLI’s study is here.
Daily Figures
The chart below shows the number of laser/aircraft incidents reported to FAA each day during 2011. The light blue line is the actual number of incidents each day. The dark blue line shows the average of the preceding 15 days. This helps to smooth the day-to-day fluctuations, making it easier to see the overall trend.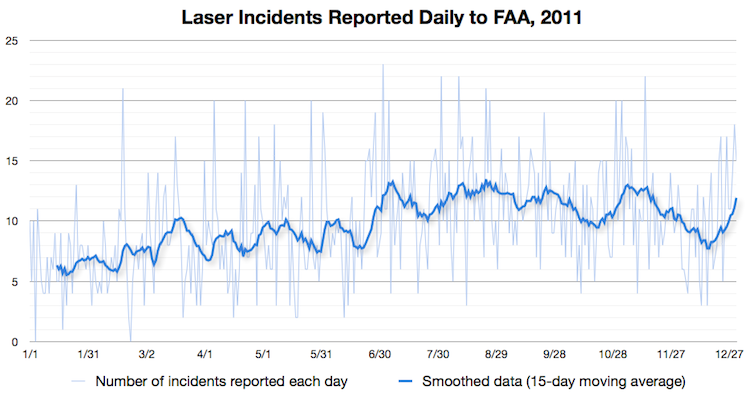
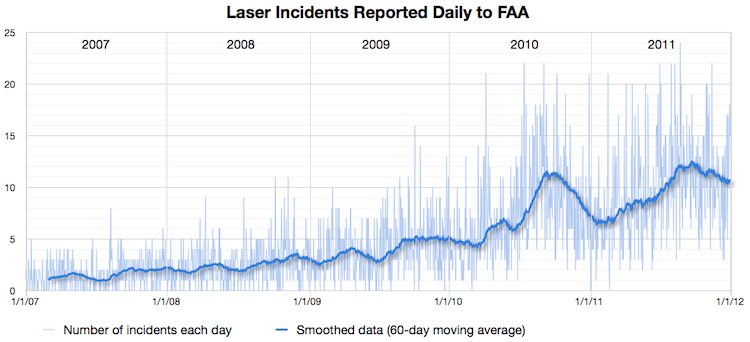
The chart below shows the same data, for the period 2007 through 2011. The data has been smoothed using a 60-day moving average.
Comparing Rate of Increase
The following chart shows that the rate of increase in laser incidents is slowing. The chart is based on the 60-day moving average line shown above. For each day beginning March 3, 2008, the 60-day moving average of the number of laser incidents reported to FAA for that date is compared to the 60-day moving average on the same date one year earlier. The result is plotted as the light blue line. This result is further smoothed (dark blue line) with a 60-day moving average, making it easier to see the overall trend.By comparing the number of laser incidents in one year to the number of incidents one year earlier, this reduces any effects from seasonal variations.
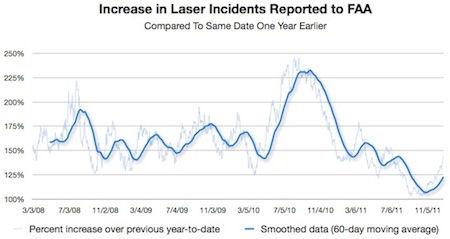
How to read the chart: Take a look around 7/5/10. The number of laser incidents on 7/5/10 was about double (200% increase) the number of incidents reported one year earlier. A peak of almost 250% was reached around September 2010. A key indicator is that since that date, the rate of increase has been falling. It almost reached 100% around 11/5/11, meaning that the number of laser incidents reported to the FAA on that date was just slightly higher than a year earlier.
Incidents By Day of the Week
The chart below shows the number of aircraft reporting laser incidents, by day of the week, for January 1 through December 31 2011. Compared to the lowest day, Sunday, there were 31% more incidents on the highest day, Friday.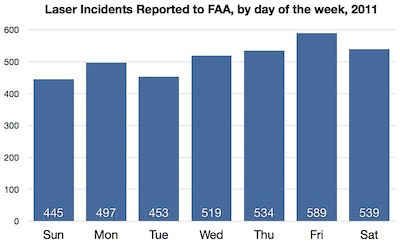
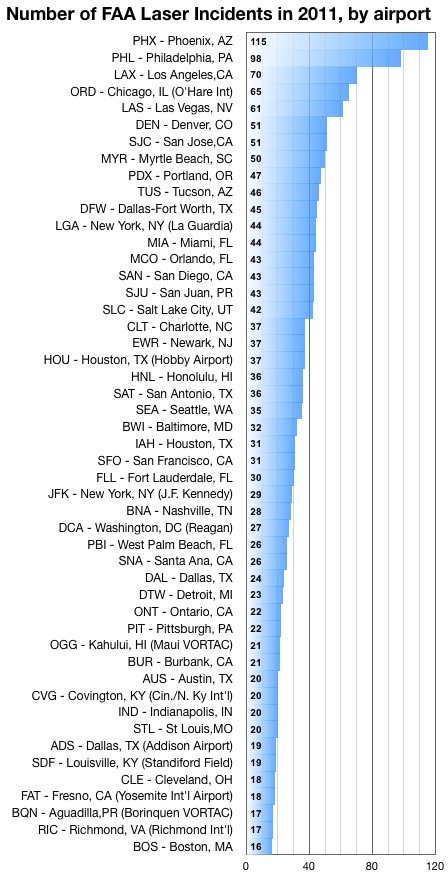
Top 50 airports
For each laser incident, the FAA records the nearest airport. This is done even for planes or helicopters illuminated while over a city or suburb, far from any airport’s flight paths. Thus, the numbers shown below include not only laser incidents involving flights into or out of an airport, but also incidents that may not be related to the airport’s operations.
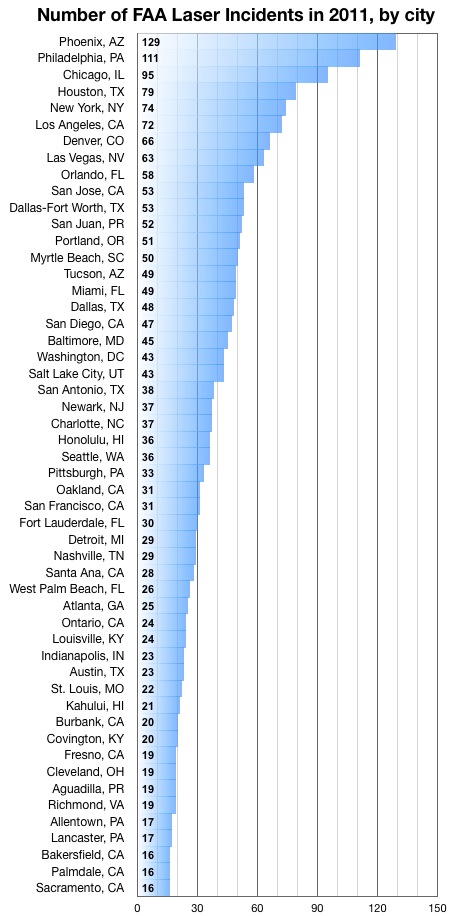
Top 50 cities
The chart below is based on FAA’s categorization of cities. Note that some persons may group these cities differently. For example, FAA reports Dallas-Fort Worth (53), Dallas (48), and Fort Worth (12) as three separate cities. if these were reported as a single city, it would be number two on the list below.
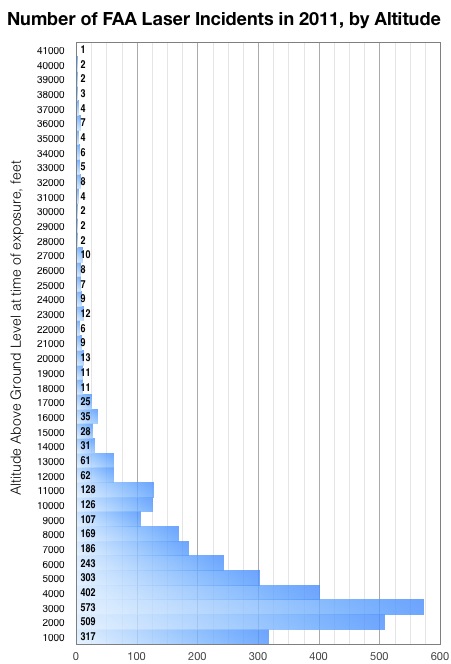
Incidents by altitude
Experts agree that pilots can safely manage being exposed to laser light if they are not in a critical phase of flight (takeoff, landing, hover, or emergency situations). Based on the FAA’s Critical Flight Zone being limited to 10,000 feet above ground level, this indicates that in most cases if an aircraft is illuminated above 10,000 feet, the FAA would not consider a laser illumination as being a flight hazard.
By this criteria, about 82% of incidents in 2011 posed a possible hazard to flights, based solely on the aircraft’s altitude. The remaining 18% of incidents occurred at an altitude where the FAA would not expect the aircraft to be in a critical phase of flight.
.