Home
A comprehensive resource for safe and responsible laser use
Laser/aircraft illumination statistics
Below are laser/aircraft illumination statistics for various countries.
Many of the data charts use Javascript.
Some statistics have not been available, or have not been updated, through the most recent year (2025 as of this writing). Even so, historical data may be valuable.
Many of the data charts use Javascript.
- For the Javascript charts, you can hover over or click on the data points (or pie segments or bars) to get exact numbers.
- Note that the Javascript charts will NOT appear if you are using Internet Explorer. Please try another browser. If you continue to have problems, contact us.
Some statistics have not been available, or have not been updated, through the most recent year (2025 as of this writing). Even so, historical data may be valuable.
-
 Worldwide - Annual and cumulative laser illuminations
 - Since 2004, pilots in eight countries have reported seeing or being illuminated by laser light over 148,000 times.As of January 2025 there have been no documented or proven reports of permanent eye injuries to pilots. In roughly 0.5% of incidents, pilots have reported eye effects or temporary injuries. (This does not include military pilots in war zones. If there are reports of injuries during conflicts, these would not be made available to LaserPointerSafety.com.)
As of January 2025, there have been no aircraft accidents. but there have been numerous disruptions of flights. This usually happens to first responders in helicopters who see lasers aimed at them, who then have to break off their original mission to find and deal with the laser perpetrator. It also has occurred a few times that aircraft have been illuminated on takeoff, and the pilot subsequently has vision issues and returns to the originating airport (for example, Virgin Atlantic flights in 2021 and 2016, and a Cessna in 2016.)
To see the data for any one year, click on a data point for the year. You'll see the cumulative total since 2004, plus all country statistics available for that year.
Data on this chart only represents eight countries. Not all countries have reported data for all years 2004-2025. So the total number of actual illuminations, worldwide, is likely to be higher. Also, pilots may not make official reports of every laser illumination they see, so again the worldwide total is likely to be even higher.
Source: Each country's data as reported elsewhere on this page -
 U.S. - Annual and cumulative laser illuminations
 - Source: The U.S. Federal Aviation Association compiles pilot-reported laser incidents into Microsoft Excel spreadsheets. The information below comes from these spreadsheets. Note that FAA data changed in April 2019; the numbers below were changed in May 2019 to use the new April 2019 FAA data.
During 2025, pilots reported 10,993 laser illumination incidents to the U.S. Federal Aviation Administration. This compares with 12,804 reports in 2024 — a 14% decrease. Since the 2023 high-water mark of 13,204 reports, there has been a decrease of 23.5%.Keep in mind that the pilot reporting rate is unknown, and may vary over time. For example, beginning around 2017 there have been anecdotal reports that some pilots have stopped reporting every laser incident they encounter, and are filing only after more serious or worrisome incidents. This would contribute to a decline in reported incidents.
Also, at times there may be publicity or reporting campaigns that would increase the number of reported incidents.
What is causing the overall increase of laser pointer aviation incident reports since 2004? In a 2021 podcast, FAA manager of operational security Tim Wallace said the agency had done a study to find out about the spike from about 4,000 reports in 2014 to over 7,000 in 2015. He said about half the increase appeared due to more actual laser illuminations, and the other half appeared due to increased pilot awareness to report illuminations.
According to a February 15 2022 Aviation Week story, the FAA has a list of possible reasons why laser pointer incidents continue, including:
• The availability of inexpensive lasers
• The abundance of lasers in stores and online
• The number of lasers given as gifts
• Stronger power levels that enable lasers to hit aircraft at higher altitudes
• Green lasers, which are more visible to the human eye than red ones
• Greater awareness by pilots reporting laser incidents, due in large part to the FAA’s extensive outreach program.
LASER ILLUMINATIONS PER 1 MILLION FLIGHTS, 2004-2024
The chart below shows the number of laser illuminations reported for every 1 million passenger and cargo flights in the U.S.
In 2020 the absolute number of laser illuminations rose 10%, from 6,213 in 2019 to 6,852 in 2020. But since the number of aircraft passenger and cargo flights dropped 38% in 2020 (from 10,363,955 in 2019 to 6,444,218 in 2020), the number of reported laser illuminations increased substantially from 599 per million flights in 2019, to 1,063 per million flights in 2020. It then stayed at the higher rate through 2021 and 2022, and increased even more in 2023, decreasing a bit in 2024.
This may not be an entirely accurate comparison since the data on number of flights is for passenger and cargo aircraft, and does not appear to include police and rescue aircraft operations. Many of the latter aircraft — especially police helicopters — are targeted by laser perpetrators.
Source data for the aircraft passenger and cargo flights is from Airlines for America's table "U.S. Airline Traffic and Capacity", referenced in January 2024; specifically, from the column "Aircraft Departures"
CUMULATIVE U.S. ILLUMINATIONS, 2004-2025
Below is the annual and cumulative number of laser illuminations reported to the U.S. FAA since 2004 when reporting was made mandatory by FAA. To get the cumulative data, each year's annual total is added to all of the previous years' annual totals. -
 U.S. - Daily and monthly laser illuminations
 - DAILY U.S. ILLUMINATIONS, 2004-2025
This chart shows the annual average number of laser illuminations reported per day to the U.S. FAA.
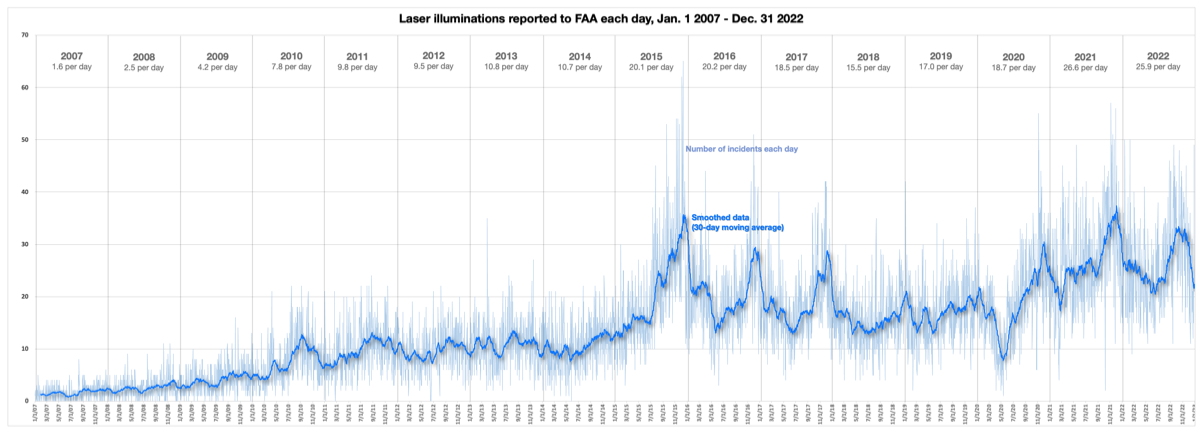
DAILY ILLUMINATIONS, 2007-2022
The chart below shows the number of laser illuminations for every single day from 2007 through 2022. Click on the chart to see a larger version
— The light blue line shows each day's illumination reports. This number can vary widely from one day to the next. (The peak was 65 incidents on Dec. 11, 2015.)
–– The dark blue line is a 30-day moving average. This helps smooth out the data in order to show longer-term trends. Because it is a moving average, effects of any events will be delayed (offset to the right) by 15 days, or 1/2 month.
This chart is based on older FAA data that have higher numbers for a few years especially for 2015. It has not been updated to use FAA's new, lower numbers released in April 2019.
MONTHLY ILLUMINATIONS, 2007-2025
The bars in the chart below show the number of laser illuminations each year from 2004 to 2025 (blue line), and for each month from 2007 to 2025. Monthly data is not available for 2004-2006.The totals for the four years 2007-2010 do not match the official FAA totals for those years as reported elsewhere in this section. (This is due to how FAA lists multiple illuminations on a single day.) However, the data does accurately indicate the relative number of illuminations for month-to-month comparisons.
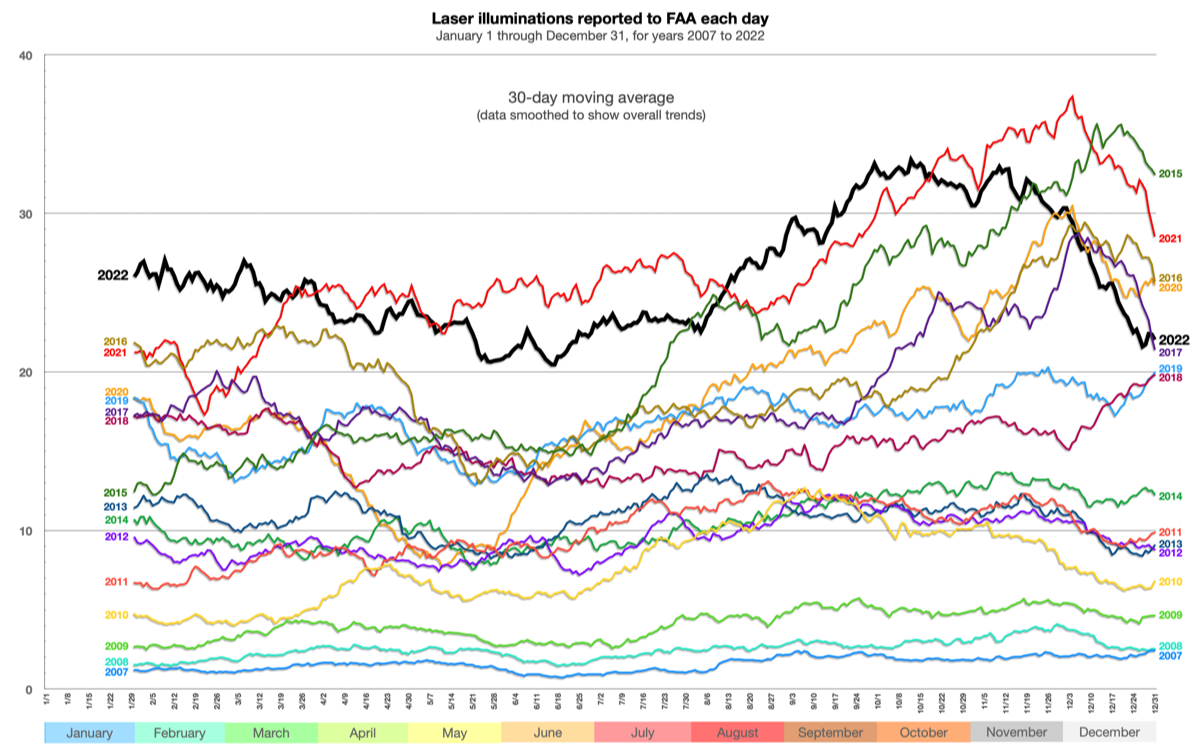
VARIATIONS WITHIN AND BETWEEN YEARS, 2007-2022
The chart below shows how the number of laser illuminations varies seasonally within each year, and how the numbers are generally increasing with the passage of years.
Lines are not drawn during January because the data is a 30-day moving average. The line plotting starts with Jan. 31.
Also, because of the 30-day averaging, the maximum number of laser illuminations in a day appears to be about 36, when as shown by a previous chart (above), the maximum number on a day was actually 65, on Dec. 11 2015.
This chart is based on older FAA data that have higher numbers for a few years especially for 2015. They have not been updated to use FAA's new, lower numbers released in April 2019. -
 U.S. overseas military illuminations, 2015-2018
 - MIDDLE EAST: According to U.S. officials in August 2018, these are the approximate numbers of U.S. military pilots that have been illuminated by laser light in the Middle East: 700 in 2015, 600 in 2016, 400 in 2017, and 350 in the first seven months of 2018. (If 2018 continues at the same pace, there will be about 600 laser illuminations in all 12 months of 2018.)
A U.S. Central Command spokesman noted that “[i]t is exceedingly difficult to pinpoint the origin of a short laser engagement.” He then claimed without further evidence that many of the illuminations “likely come from insurgents and terrorist organizations.”
However, the chart below shows that the lasing rate of aircraft in the U.S. is very roughly 10 times that of the lasing rate of U.S. military aircraft in the Middle East — and it is likely that most U.S. domestic illumination incidents do NOT come from insurgents or terrorist organizations. Story here.EAST CHINA SEA: U.S. officials said that from September 2017 to mid-June 2018, about two dozen U.S. military aircraft had been illuminated by “smaller, commercial grade” laser pointers, from ships and shore locations around the East China Sea. Story here.
DJIBOUTI: In a May 3 2018 press conference, a Pentagon spokesperson said that China has aimed lasers at American aircraft at Camp Lemonnier in Djibouti between two and 10 times. They did not say over what time period this happened. Story here. -
 U.S. - Laser colors; aircraft types; altitudes
 - LASER LIGHT COLORS, 2022
In 2022, most U.S. FAA-reported illuminations involved green laser light. However, blue light laser reports have been increasing over time. In 2022, 11.0% of illuminations were blue, compared with 8.8% in 2021, 9.2% in 2020, 8.2% in 2019, 5.4% in 2018, 3.7% in 2017, and 2.9% in 2016.The vast majority of incident reports stated there was only one color of laser light that illuminated the aircraft. However, 1.49% of incident reports did list multiple colors, while 1.54% of reports said the color was "unknown."
HOLIDAY CHRISTMAS LIGHTS
It appears that holiday Christmas laser projectors are not a serious or significant problem for aircraft. There are relatively few reports of laser strikes that could be from these devices.
It may be that homeowners are more aware to be careful when aiming their lights. Also, pilots may be more "used to it" and thus are reporting fewer sightings.
In 2022, there were no laser illumination reports to FAA (out of 9,427 total) that specifically mentioned Christmas or holiday outdoor house lights, as a known or suspected source of laser illumination. This compares with four FAA reports of Christmas/holiday lights in 2021, three in 2020, 11 in 2019, and 17 in 2018.
In 2022, there were 11 laser illumination reports of seeing both red and green laser colors. While these reports did not mention Christmas or holidays, red and green are the most common colors found in outdoor Christmas laser projectors sold to consumers. Five of these reports occurred in January 2022, the others were in February, March, July, August (2), and early November.
In 2021, there were 30 laser illumination reports of red and green lasers. Of these, two were reported during January 2021, 19 in February through October, four in November, and five in December.
TYPE OF AIRCRAFT, 2020
In 2020, 89% of the 6,852 reported laser illuminations in the U.S. occurred to fixed wing aircraft, while 10.5% involved helicopters. "Unknown" accounted for 0.3% (19 reports), and there were two reports of blimps being illuminated.
It should be noted that a variety of operators use helicopters, including police, medical, rescue, military, and news reporting. Also, police and others often use fixed wing aircraft. For this reason it cannot be inferred that all fixed wing aircraft are commercial/general aviation, and all helicopters are police/public service.
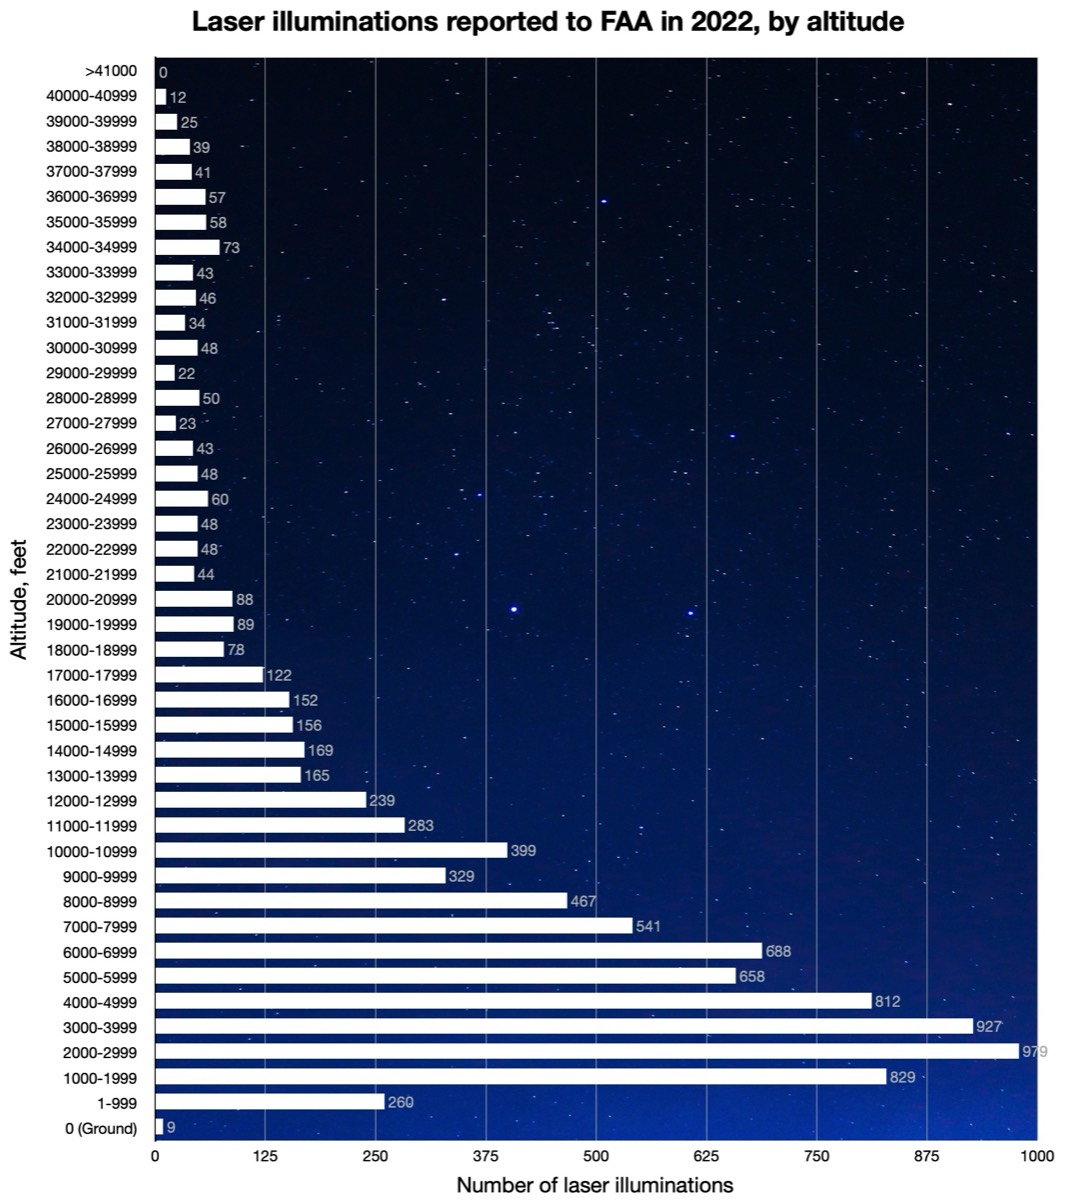
ALTITUDE, 2022
Analyzing this data shows that half of all illuminations occurred below 6,000 feet altitude. This is understandable in part because laser beams spread out as they travel. Beams are more visible when a pilot is closer to the laser source on the ground.
But this is also worrisome, since as pilots get closer to the ground, there is less time to react and recover when illuminated by laser light.
The data does not include 143 additional incidents for which the altitude was unknown. Click on the chart for a larger version.
-
 U.S. - Arrests & convictions
ARRESTS AND CONVICTIONS, 2005-2013
According to Ars Technica writer Cyrus Farivar, in the U.S. from 2005 to 2013 there were 134 arrests for aiming lasers at aircraft, out of 17,725 FAA-reported laser illumination incidents. He wrote “That means that even amongst reported incidents, there’s only a 0.75 percent chance of getting caught. Adding countless unreported incidents would only make that minuscule percentage go down further.”
Farivar noted that there were 80 convictions among the 134 arrests. One reason for the conviction rate of 60%: some who were arrested were minors who were never formally charged.
A selected list of persons convicted for laser pointer-related crimes, in the U.S. and worldwide, is here.FINES
The U.S. Federal Aviation Administration has "issued over $600,000 in fines since 2016, and $120,000 this year [Jan.-Sept. 2021] for laser strikes against aircraft", according to FAA Administrator Steve Dickson. He gave these figures in a short video released September 1 2021 to announce the FAA's new laser strike data visualization webpage.
-
 U.S. - Eye effects and claimed/actual injuries
 - The U.S. Federal Aviation Association compiles pilot-reported laser incidents into Microsoft Excel spreadsheets. The information below comes from versions of these spreadsheets with additional columns that include details about any pilot-reported eye effects or claims of injury.
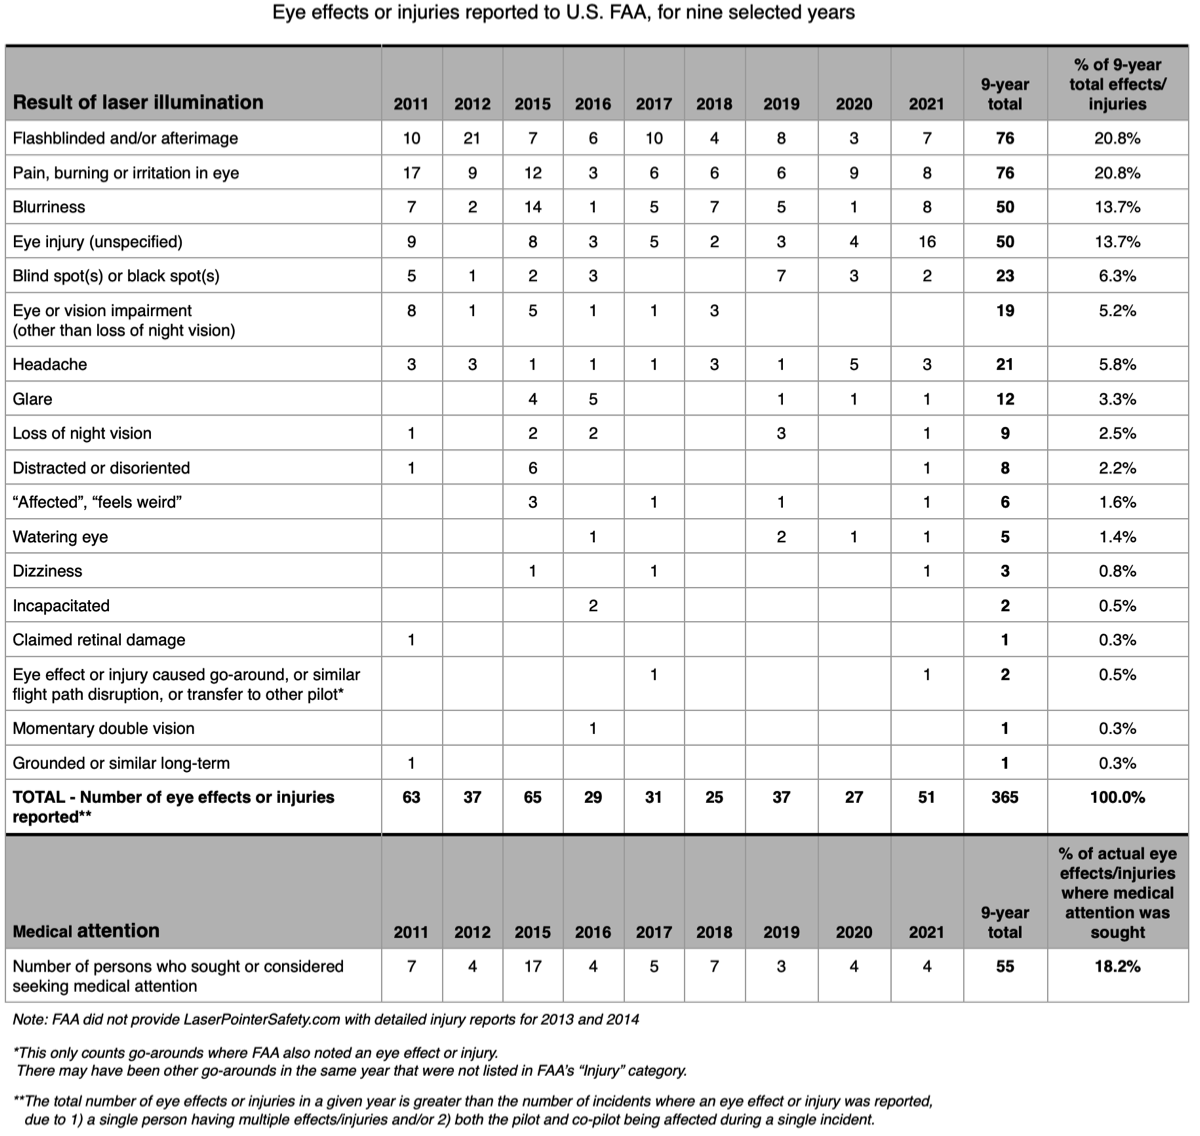
In a few cases per year, the FAA may put a "Yes" in the spreadsheet "Injury" column for an incident, even though the detailed description is clear that there was no eye effect or claimed/actual injury. The number of all FAA-counted "Injury" incidents are listed below in gray type; the black type has the number of actual eye effects or claimed/actual injuries in each reported year.
These charts are based on older FAA data that have higher numbers for a few years especially for 2015. They have not been updated to use FAA's new, lower numbers released in April 2019.
Out of the 57,422 total laser incidents in the table above, 0.5% resulted in eye effects or claimed/actual injuries to the crew. This rate is slightly lower than an Australian study which found that out of 1,316 laser illuminations from 2010-2014, 15 or 0.8% resulted in flight crew incapacitation.
The table below shows that for the 302 total FAA-reported incidents with actual eye effects or claimed injuries, there were 365 different reported effects or claimed/actual injuries. This is because some persons reported multiple effects, and/or both the pilot and co-pilot were affected during a single incident.
In 18.2% of the 302 incidents, a crew member sought or considered seeking medical attention.
The pie chart below has the same information as the table above. It shows, out of the 365 total reported eye effects or injuries 2011-2021, the percentage of each type of eye effect or injury.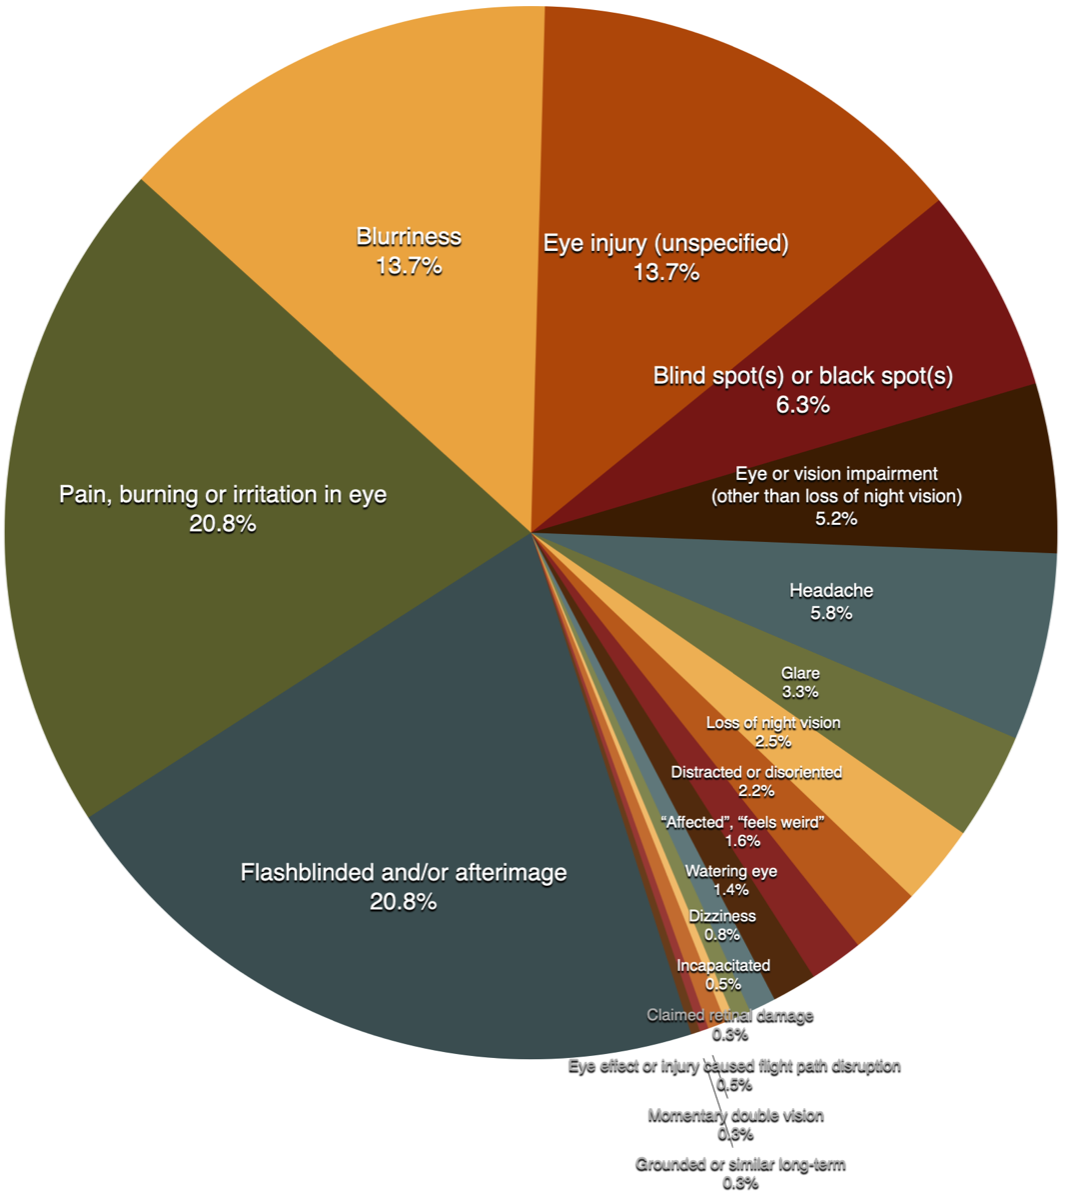
-
 U.S. - Public data directly from FAA
 - EXCEL SPREADSHEETS
The U.S. Federal Aviation Administration has a webpage with Excel spreadsheets listing reported laser incidents from 2010 to the most recent data available.
INTERACTIVE DATA VISUALIZATION
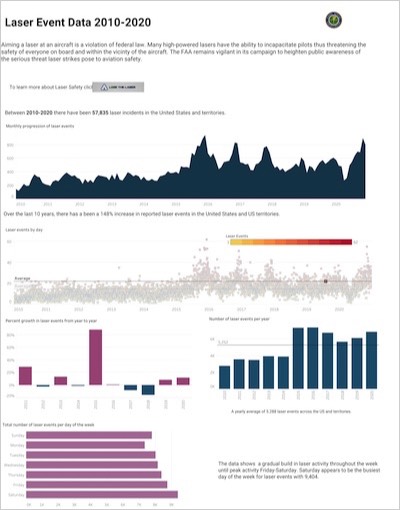
FAA also has an interesting data visualization webpage, part of which is shown here. The page has interactive charts showing various aspects of incident data from 2010 onward.
This includes graphs of yearly, monthly and daily laser event numbers, data on events by month and by day of the week, states ranked by raw numbers and on a per capita basis, injuries, and altitudes at which lasers were seen.
By clicking on data points or sections of a chart, a box pops up with more precise information.
LASERPOINTERSAFETY.COM USES FAA DATA
This website, LaserPointerSafety.com, uses FAA data for our own analyses of U.S. incidents which are listed in the sections above.
In a few cases, after we did an analysis, FAA changed their numbers slightly. For this reason, you may find slight discrepancies between our data and FAA's current online Excel spreadsheets. These differences are not statistically significant.
SOME FAA CHARTS ARE LIMITED OR NOT INFORMATIVE
Many of the FAA charts are very interesting, such as the number of laser events per capita for each state.
However, some charts are near useless such as the "injuries" chart. This is organized by state, not by type of injury. Worse, there is no information provided about what counts as an injury, or the severity and outcome of the reported injury. (We have our own injury analysis chart on this page which is much more detailed.)
Another near-useless FAA chart is one that shows aircraft altitude during the incident. There are data points with the number of flights at a given altitude. But there is no attempt to group altitude ranges together, for example, to find out how many laser incidents happened between 0-1000 ft, between 1000-2000 ft, etc. To see a properly formatted chart, open the section above for "U.S. - Laser colors; aircraft types; altitude".Click on the image to go directly to the FAA data visualization page. If the link does not work, try accessing it from the main FAA laser safety webpage. -
 United Kingdom - Domestic and overseas laser illuminations
 - In 2018, UK airports reported 775 laser illuminations to the Civil Aviation Authority. This is a 22% decrease from the 989 illuminations in 2017. In addition, there were also 166 laser illuminations overseas (non-U.K.) in 2018. This is a 32% decrease from the 243 overseas illuminations in 2017.Below are the 775 laser illuminations in 2018, broken down by closest airport. (This does not mean that all incidents involved aircraft flying into or out of the airport. Many illuminations occur to police and rescue helicopters which may be in the city center or otherwise far from an airport. In the chart below, these are mapped to the closest airport.)
- 55% of pilots experienced a laser illumination, September 2015 to September 2016, according to BALPA. Story here; number also mentioned here by CAA.
- A story on laser illuminations of police aircraft in 2015; one helicopter in South Yorkshire has been hit nearly 100 times.
- According to the Daily Mail, “Between 2009 and June 2015 more than 8,998 laser incidents across the country were reported to the UK Civil Aviation Authority.” For comparison, there were about 21,400 incidents in the US during that time period. Story here.
- In 2014 and 2015 there were 118 incidents where lasers were aimed at the drivers of trains. Story here.
- From a 2017 open consultation document published by the U.K. government: “Records from British Transport Police show that between 1 April 2011 and 31 October 2016, a total of 466 laser incidents [targeting trains] were recorded. This equates to approximately 85 incidents per year. We believe these incidents are under-reported since these offences are not currently recordable as a crime.” This statistic is also mentioned on page 2 of this House of Lords Library Briefing.
- There have been a total of 578 laser illumination incidents on British railways from 2011 to late 2017, according to British Transport Police. Story here.
-
 Canada
 - Source: The 2008-2011 incident numbers below are from a February 2016 analysis by the Ottawa Citizen of Transport Canada’s CADORS database. The 2012-2017 incident numbers for the entire country, and for each province/territory, are from Transport Canada information provided to LaserPointerSafety.com in February 2018. The 2018 number of 211 is from a news story quoting a Transport Canada media advisor. The 2020 number of 236 is from a CBC news story.In February 2018, Transport Canada provided to LaserPointerSafety.com a breakdown by province/territory of laser illumination incidents, from 2012-2017:
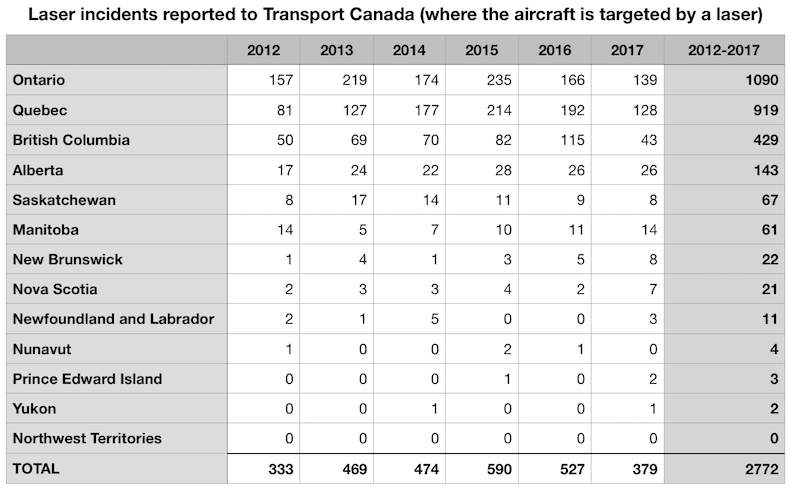
For the second chart, province-by-province data was not provided for 2008-2011 and 2018-2020. These years have been left blank so this chart can be directly compared with the first chart above. The following were not included in the bars due to low numbers of incidents during the 2012-2017 period: Nunavit (4), Prince Edward Island (3), Yukon (2) and Northwest Territories (0). The red line (TOTAL) does include all provinces and territories.According to Transport Canada, in 2015 there were 590 reported laser illumination incidents. This is an increase over 502 incidents reported in 2014. Story here.
A February 2016 story in the Ottawa Citizen says in 2015 there were well over 663 incidents, while Transport Canada says there were 590 incidents. A March 2020 story in the National Post also lists numbers significantly higher than Transport Canada for 2015 and later. The reason for these discrepancies with the Transport Canada figures is not known.
A May 2021 CBC story states that there were 236 reported laser illumination incidents in Canada during 2020 "despite steep penalties." -
 Australia
 - In 2016 and 2017, there were 544 and 541 laser illumination incidents, respectively. This is an 8% increase from the 502 laser illumination incidents in Australia in 2015. 2015 story here with more charts.Note that in mid-2008, Australian states enacted severe restrictions on laser power, and on laser possession. Despite these stringent laws, the rate of laser illuminations continued to climb for four more years, and remains higher than when the ban went into effect.
While Australia's number of laser illumination incidents is lower than the United States, the country also has 14 times fewer people than the U.S. If Australian lasing rates are multiplied by 14, this allows a per capita comparison between Australia and the U.S. — as seen below. The blue line and shaded area is the number of aircraft illuminations reported in the U.S., the purple line is the number in Australia if the two countries had equal populations.Australia actually had more aircraft lasings, per capita, than the U.S. up until 2015. Since then the two countries' rates have been roughly equal.
From 2010 through 2014, there were 113 flight crew incapacitations in Australia — an average of about 23 per year. Most were caused by gastrointestinal illness, but the second leading cause of pilot incapacitations was laser strikes. Of the 113 incapacitations, 15 (13.3%) were due to laser strikes, according to a 2016 study by the Australian Transport Safety Bureau. -
 New Zealand
 - The 2020 number of laser illuminations of aircraft is low because New Zealand's flights were reduced due to the COVID-19 pandemic restrictions.
To get a clearer picture, the chart below takes into account that there are a different number of flights each year. It shows the number of laser illuminations per one million flights, from 2011 to 2020.Based on this analysis, the rate of laser illuminations of New Zealand aircraft may have increased during the pandemic year of 2020.
On the other hand, the number of flights probably does not include police and rescue flights. Since many laser incidents occur to such flights, a more comprehensive analysis would need to account for these flights. It is not known if data exists to determine the total number of aircraft flying from all locations including airports and first responder facilities.
Source data uses "airport movements" defined as takeoff, landing or missed approach handled by Airways New Zealand. The number of flights is approximately 1/2 the number of movements. Source data for 2011-2019 New Zealand movements is here, covering each year from 2011 to 2019. For 2020, the NZ data was estimated as follows: Take the Auckland Airport airport movements data for 2017, 2018 and 2019 which can be found here. Determine the proportion of Auckland Airport movements as a percentage of New Zealand movements. Find the average of the three years, then multiply this by the 2020 Auckland Airport movements to find the estimated 2020 New Zealand movements. Convert movements to flights for final data. This analysis assumes that the number of 2020 Auckland Airport flights roughly track the 2020 NZ countrywide flights.
- Data in the top chart was provided by the Civil Aviation Authority of New Zealand (CAA-NZ) on March 15 2021. The other sources listed immediately below also quote numbers which may be slightly different.
- A January 2019 story has slightly different numbers than the March 15 2021 report immediately above and the 2017 story immediately below — even though the source in all cases is said to be CAA-NZ. The January 2019 numbers are: 99 incidents in 2014, 87 in 2015, 132 in 2016, 171 in 2017 and 228 in 2018.
- In 2017, approximately 169 laser illumination incidents, according to the Civil Aviation Authority. 152 incidents in 2016, 104 incidents in 2015. Story here. The second chart above (top 5 locations) uses this 2017 story as the source.
- 116 incidents in 2013, and an estimated 104 incidents in 2014. New legislation took effect March 1 2014 to restrict the importation and sales of lasers over 1 milliwatt. Story here and earlier story here.
- "During 2007, the CAA received 20 reports of aircraft being targeted by laser beams. One of these occurrences was in Sydney, 15 in the Wellington area, one near Auckland, and three in the vicinity of provincial airports. All were green beams and were probably from hand-held laser pointers….". From an article in the January/February 2008 Vector magazine, reprinted here.
-


 Five countries' laser rates compared …… and did restrictions in Australia and New Zealand help?
 - Here is a direct comparison of the U.S., U.K., Canada, Australia and New Zealand laser illumination incident numbers for the years 2007-2020. (U.K. data is not available for 2007, 2008, 2019 and 2020; Canada data is not available for 2007 and 2018-2020.)The chart above does not take into account the fact that the U.S. has roughly 5 times the population of the U.K., 9 times the population of Canada, 14 times the population of Australia and 70 times the population of New Zealand.
In contrast, the chart below shows the laser illumination incident rates adjusted on a per capita basis. This is done by multiplying each country's data as if it has the same population as the U.S.:RESTRICTIONS DID NOT HELP IN AUSTRALIA: In mid-2008, Australian states enacted severe restrictions on laser power, and on laser possession. Pointers and handheld lasers over 1 milliwatt were essentially banned. Despite this ban, Australian laser illuminations increased (purple line). As of 2015-2017, Australia's per capita lasing rate has been roughly equal to the United States' per capita lasing rate (blue line).
RESTRICTIONS DID NOT HELP IN NEW ZEALAND: On March 1 2014, New Zealand banned the importation and sale of laser pointers over 1 milliwatt. Despite this ban, New Zealand laser illuminations increased (burgundy line) and as of 2020, are far higher on a per capita basis than any other country. -
 Ireland
 - Incidents of lasers aimed at aircraft in Ireland fell from 153 in 2014, to 134 in 2015, and could be less than 50 in 2016, according to the Irish Aviation Authority. Story here.
- There were 158 laser illumination incidents in 2013. Story here.
- In April 2019, the Irish Examiner writes "In 2014 the State Airports (Shannon Group) Act made it illegal to aim laser pens at aircraft. As of August 26 2016, there were 31 reports of lasers deliberately pointed at aircraft in Irish airspace. Since the legislation was introduced, there has been a significant decrease in the number of laser incidents reported by Irish pilots in Irish airspace to Irish Air Traffic Control."
-
 Northern Ireland
 - 35 aircraft illumination incidents in 2015. Sixteen incidents from January 1 through mid-October 2016. Story here.
-
 Scotland
 - An April 2013 investigation by the Scottish Express found 338 laser illumination incidents in Scotland from January 1 2011 through February 13 2013. Only 12, or 3.5 percent, had been solved. Story here.
- In a story about a May 14 2012 laser incident, the Scotsman reported that there were 107 laser illumination incidents involving aircraft in Glasgow during 2011, up from five incidents during 2008. Story here.
-
 Sweden
 - In 2008 the Swedish Radiation Protection Authority (SSM) banned the possession or use of lasers over 5 mW in public space without a permit. In 2013, police and security personnel were given more authority to search persons and confiscate non-legal lasers.
The data below comes from a presentation by Martin Lindgren of the SSM, given at a symposium given January 15 2019 in Tokyo. -
 Germany
 - There were 113 laser illuminations of aircraft reported in Germany during the first half of 2018, compared with 129 reports in the first half of 2017, according to Deutsche Flugsicherung, the German air traffic control company. This is a decrease of 12.4%. This country-wide decrease is despite a doubling of incidents at Frankfurt International Airport. In the first half of 2018 there were 22 laser illuminations at Frankfurt versus only 11 during the same period in 2017. Story here.
In Germany during 2012, there were 261 incidents reported of lasers being aimed at aircraft. Twenty-seven of these were in the Berlin area. Story here. -
 South Africa
 - A May 2019 news story said "More than 70 incidents of lasers aimed at the cockpits of aircraft on final approach were reported to Air Traffic and Navigation Services last year [2018]. The majority were in Cape Town, with incidents also reported at OR Tambo International, Pretoria’s Wonderboom and Lanseria International." Story here.
- 20 reports of laser illuminations of aircraft in the 47 days between January 1 and February 16 2016. Story here.
- There have been 170 laser incidents in South Africa to date [Jan 1 - Aug 1 2012] in 2012, according to the director of the South African Civil Aviation Authority (SACAA). That is roughly on pace for 290 incidents for the entire year, which represents a 66% increase over the 175 incidents in 2011. Story here.
- There have been 181 laser/aircraft incidents recorded in South Africa, from January 1 2010 to February 29 2012, according to the Air Traffic and Navigation Services (ATNS). Story here.
-
 Taiwan
 - In a 2017 news story, Taiwan officials said that in previous years there had been four to five reports per year of laser interference. In the first six months of 2017, there were eight reports.
-
 Japan
Japan - Beginning in 2010, Japanese pilots were required to report laser illuminations to the Japan Civil Aviation Bureau. The first complete year of data is 2011. The data comes from Professor Yuichi Hashishin of Kindai University, at a symposium given January 15 2019 in Tokyo.

